

ZEISS Quality Software
Explore our software solutions - from inspection to data managementHigh flexibility combined with high-precision analyses
High quality in the production process? Quite simple, if you have the right tools. With ZEISS Quality Software, you can analyze your components precisely and intuitively. Depending on your requirements, you create data evaluations, analyses and reports across technologies and systems for a holistic quality management.
Metrology and inspection software


Data and quality management software


Services
Benefit from our holistic services: With our comprehensive training program and other services such as the expert forum, software support or the online help, you can continuously improve your results in the ZEISS Quality Software.


Schedule a demo at a ZEISS Quality Excellence Center near you
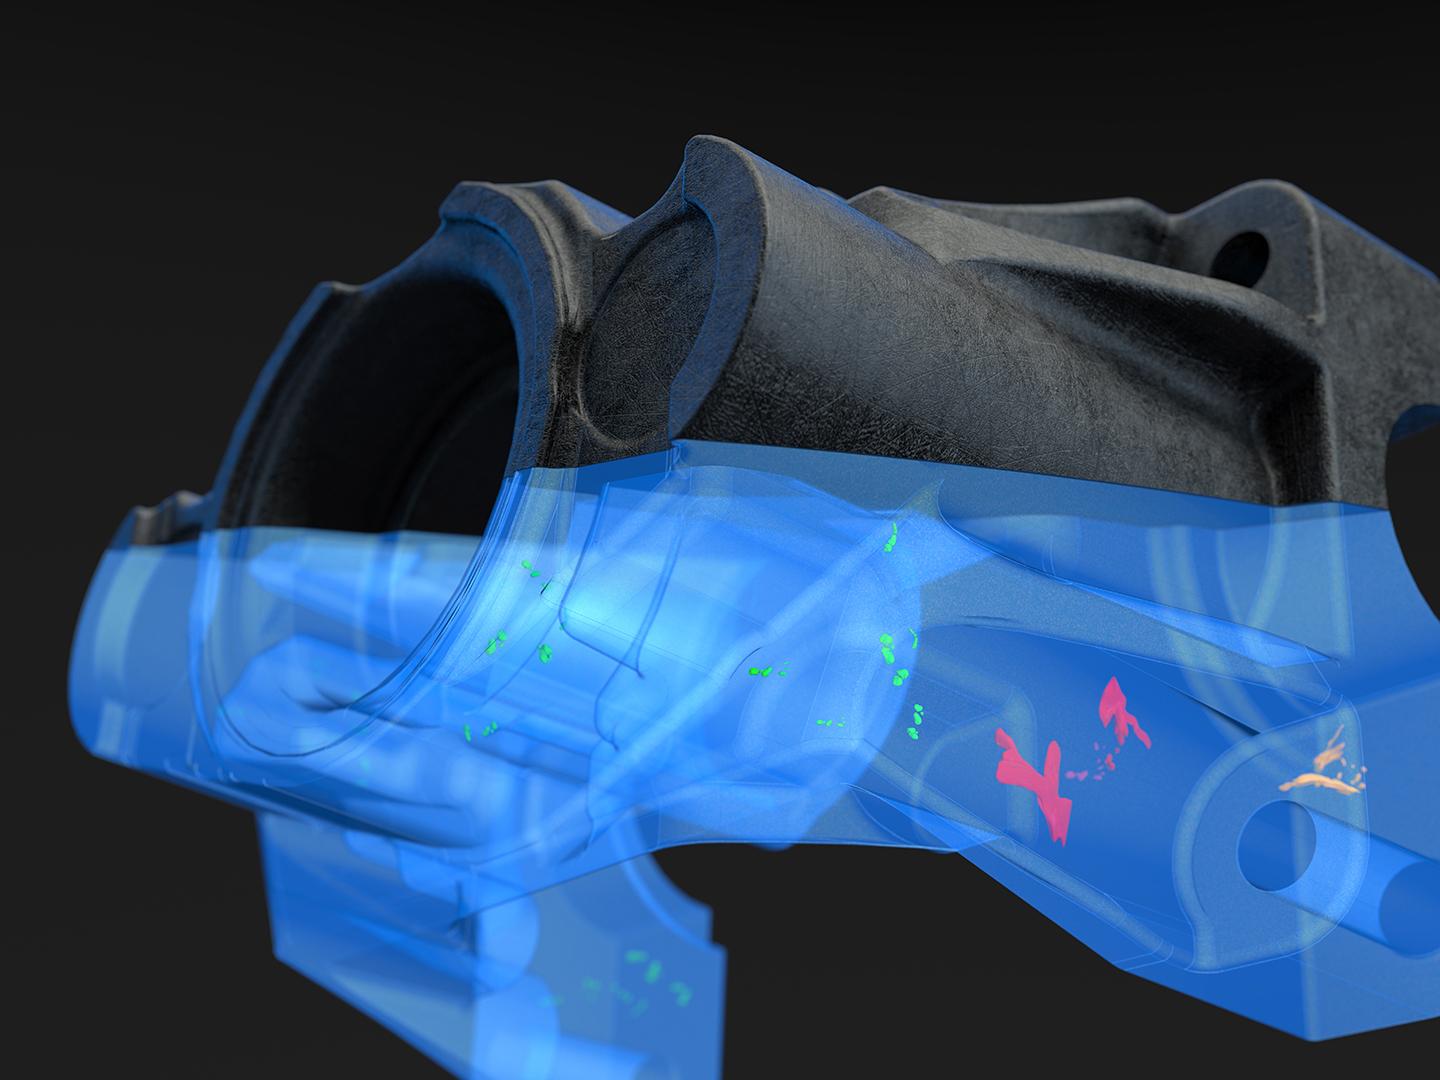
ZEISS Quality Excellence Centers in Southeast Asia provide hands-on access to the latest metrology solutions, including CMMs, 2D X-ray systems, 3D X-ray (computed tomography - CT) systems, light microscopes, digital microscopes, scanning electron microscopes and optical 3D scanners. Whether you need a live demo with your own parts or expert measurement services, our specialists are ready to support your quality assurance needs.
We have ZEISS Quality Excellence Centers in Malaysia, Thailand and Vietnam. We can also support your demo, training, measurement and inspection needs in Singapore, Indonesia and Philippines at our partners' sites.
FAQ
-
You can find more information about the ZEISS Quality Suite here.
This link leads you to the direct download. -
Currently, you can access the complete ZEISS INSPECT solution as well as ZEISS PiWeb, ZEISS CORRELATE, ZEISS REVERSE ENGINEERING and ZEISS CALIGO via the ZEISS Quality Suite.
-
With a ZEISS Software Maintenance Agreement (SMA), you and your company can benefit from additional services to release the maximum performance of your ZEISS systems and avoid machine downtime. Regular software updates are the prerequisite for future-proof processes. ZEISS software maintenance guarantees long-term quality and brings many other benefits. You are always up to date with the latest measurement software for maximum productivity, plus you save time with plannable and predictable upgrade installations.
-
You can also use various ZEISS Quality Software products without a ZEISS system. Our analysis software is device-independent. With ZEISS INSPECT, for example, you can evaluate and analyze your optical 3D or volume data, regardless of the source, and create comprehensive reports. ZEISS PiWeb works independently of the measuring technology and even integrates manually achieved data.
-
Yes, of course. You can obtain the ZEISS Quality Suite free of charge here. You can also test many of our software variants for a time, for example ZEISS INSPECT. You can receive and activate the test license within the ZEISS Quality Software Store.